Microsoft Azure:- Using PowerBI to visualise NSG flow logs
Microsoft Azure:- Using PowerBI to visualise NSG flow logs
Moving on.. having recently deployed a number of NSG (Network Security Group) rules into an environment within Microsoft Azure I wanted to review the network traffic further and check what rules I still need to add. For NSG data flows to be viewable I needed to enable and configure Network Watcher on the NSG. Network data flows now flowing to where? Well, network data is inputted into a Storage Account and as configured - parsed into Microsoft Log Analytics using the Network Performance Monitor module which is enabled automatically after enabling Network Watcher above.Go from data to insights in minutes. Any data, any way, anywhere. And all in one view.
Using Log Analytics is fine if you were to retrieve some instant information such as:-
- Top Protocols used
- Subnets receiving traffic
- Agents capturing network traffic
Not recommended for what I was after, the ability to filter through the recent network traffic and determine which source/destination IP ranges I was missing. With the above configuration for network watcher, traffic analytics can also be used - similar to the module above, a series of queries would have to be ran before I would have received the output I was after.
This is where I researched and found that PowerBI was the solution I was after along with the network watcher template for PowerBI. Using PowerBI desktop and the required template, I was able to parse the Storage Account where network watcher was storing the NSG traffic and could visual within minutes:
- Top Talkers
- Time Series Flow Data by direction and rule decision
- Flows by Network Interface MAC address
- Flows by NSG and Rule
- Flows by Destination Port
You must also have the Power BI Desktop client installed on your machine, and enough free space on your machine to download and load the log data that exists in your storage account.Total game changer! [caption id=" align=" width="861"]
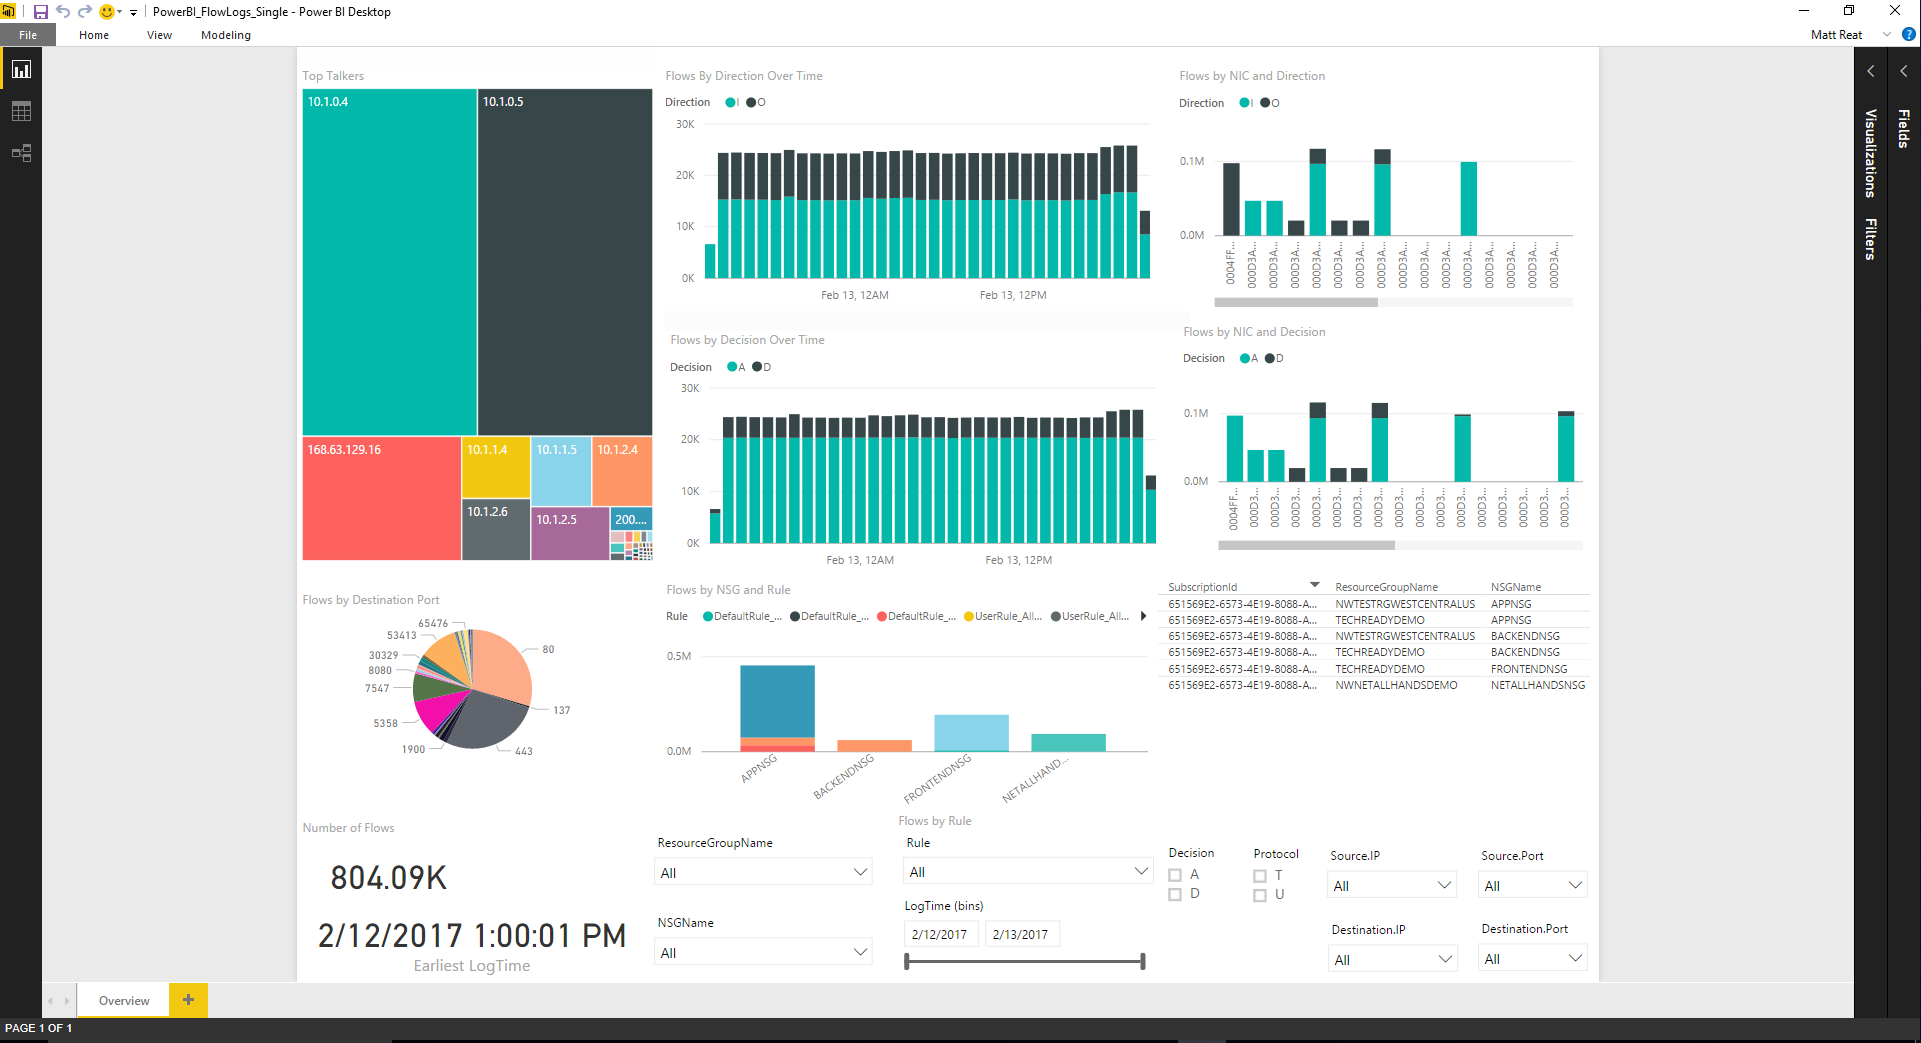 Image reference: msdn.microsoft.com[/caption]
Diagram above showing the process of PowerBI
Diving into PowerBI desktop I went, the initial splash screen of wonderful colours everywhere, instantly I was able to see some cool outputs and potentially helpful data
I wanted to drill into this data without the need to run a number of queries, to my surprise I was able to view this type of data instantly - it felt like Microsoft Excel's bigger brother.
Below shows two screenshots, I was able to filter by rule so I could view any wanted ports that did not have a specific rule as of yet.
Image reference: msdn.microsoft.com[/caption]
Diagram above showing the process of PowerBI
Diving into PowerBI desktop I went, the initial splash screen of wonderful colours everywhere, instantly I was able to see some cool outputs and potentially helpful data
I wanted to drill into this data without the need to run a number of queries, to my surprise I was able to view this type of data instantly - it felt like Microsoft Excel's bigger brother.
Below shows two screenshots, I was able to filter by rule so I could view any wanted ports that did not have a specific rule as of yet.
